Pasta Plots

What better way to combine food and math, than with MATLAB?
I always enjoy applying newly gathered knowledge to fun projects to refine them. During a finite element course at the beginning of my studies at the Technical University of Munich (TUM) I learned to generate meshes and 3D images in MATLAB. Being the food lover I am, I wanted to see if I could apply mesh generation to different kinds of pasta. And so 'Pasta Plots' was created.
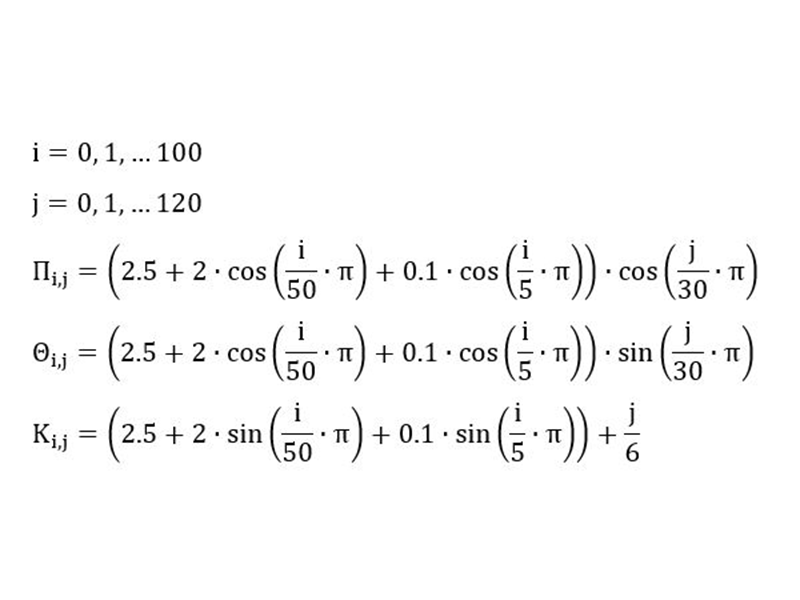
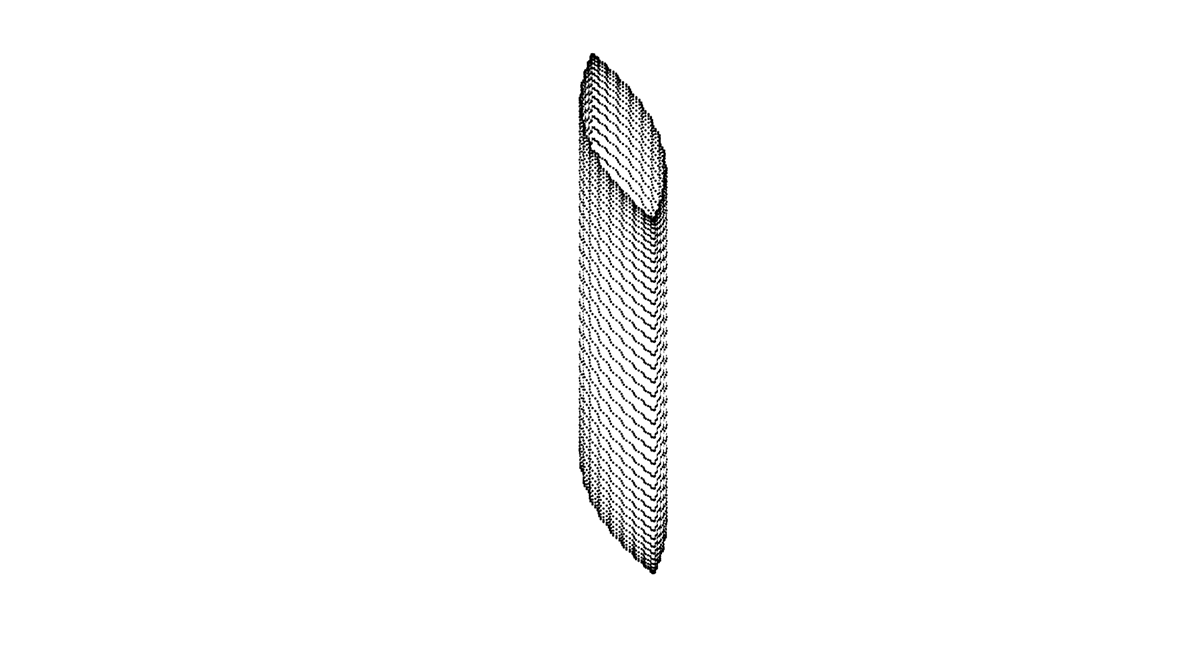
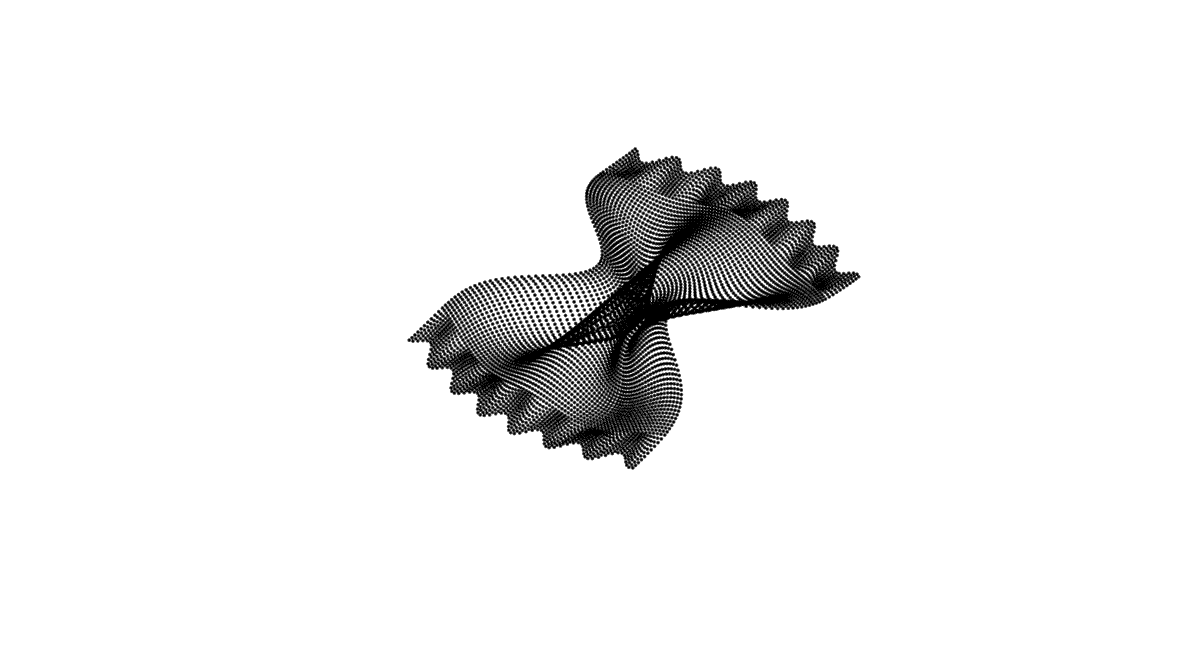
Most of my pasta equations are based on the book ‘Pasta and Design’ by George L. Legendre. The code, mesh generation and visualization are based on a simple MATLAB program I programmed myself. Generally, a ‘Pasta Plot’ consists of three formulas which describe every single pasta node in X, Y and Z. Each formula is a function of i and/or j which are defined as a range. Once inserted into the formulas of X, Y and Z, the ranges of i and j allow the calculation of every point in a plot.
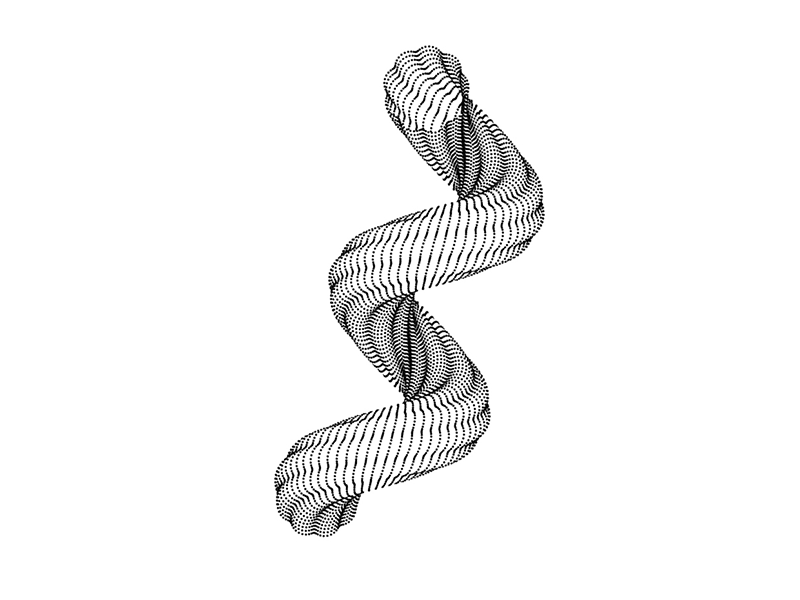
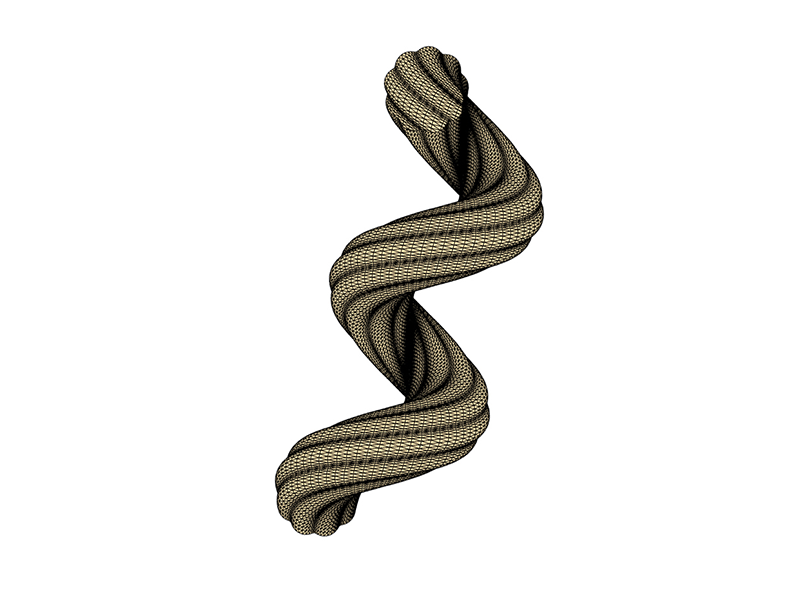
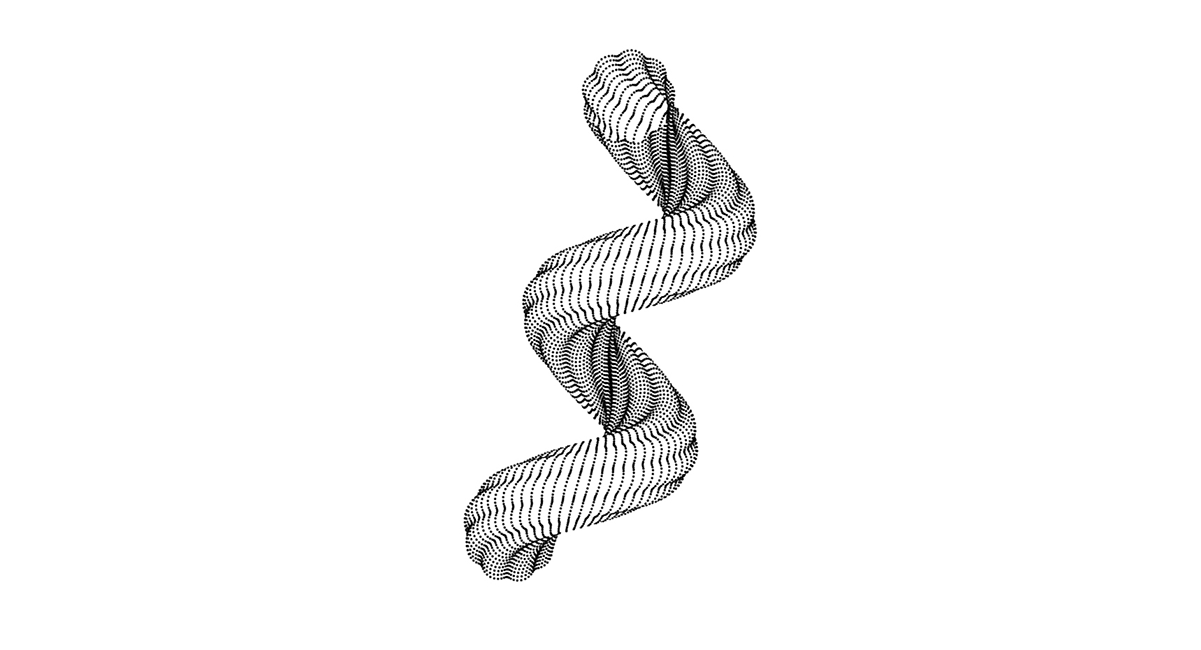
My favorite ‘Pasta Plots’ are showcased in the slides above: Spirali, Penne Rigate, Chifferi Rigati and Farfalle.
Currently, all ‘Pasta Plots’ are only digital. The next step is to convert the MATLAB mesh into an .stl-file and 3D print a pasta. Maybe there is even a way to print an edible product.
I sometimes showcase my pasta plots on my Instagram @moritzgeorgkolb . If you like pasta and MATLAB as much as I do, then you might be pleasantly surprised!
I always enjoy applying newly gathered knowledge to fun projects to refine them. During a finite element course at the beginning of my studies at the Technical University of Munich (TUM) I learned to generate meshes and 3D images in MATLAB. Being the food lover I am, I wanted to see if I could apply mesh generation to different kinds of pasta. And so 'Pasta Plots' was created.
Most of my pasta equations are based on the book ‘Pasta and Design’ by George L. Legendre. The code, mesh generation and visualization are based on a simple MATLAB program I programmed myself. Generally, a ‘Pasta Plot’ consists of three formulas which describe every single pasta node in X, Y and Z. Each formula is a function of i and/or j which are defined as a range. Once inserted into the formulas of X, Y and Z, the ranges of i and j allow the calculation of every point in a plot.
My favorite ‘Pasta Plots’ are showcased in the slides above: Spirali, Penne Rigate, Chifferi Rigati and Farfalle.
Currently, all ‘Pasta Plots’ are only digital. The next step is to convert the MATLAB mesh into an .stl-file and 3D print a pasta. Maybe there is even a way to print an edible product.
I sometimes showcase my pasta plots on my Instagram @moritzgeorgkolb . If you like pasta and MATLAB as much as I do, then you might be pleasantly surprised!